Quarterly Pipeline Review
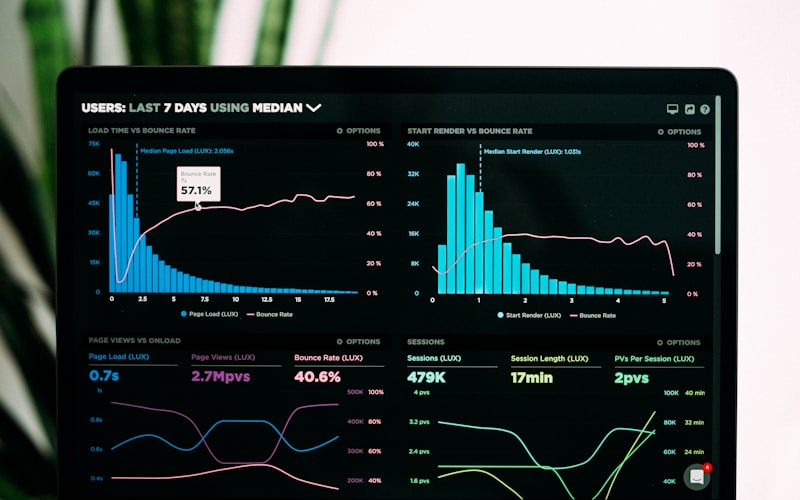
A full-cycle analysis of your B2B sales pipeline with stage conversion charts, velocity readings, coverage ratios, and forecast drift—delivered as an executive report with a live walkthrough.
View engagement details →Busan · B2B Commercial Analytics
Hazel Hub Analytics prepares quarterly pipeline reviews, stage-conversion studies, and forecast accuracy reports for commercial managers who need clear numbers before board meetings—not another slide deck of guesses.
Engagement Types
Each engagement begins with your CRM export and ends with annotated charts your leadership can act on within the week.
A full-cycle analysis of your B2B sales pipeline with stage conversion charts, velocity readings, coverage ratios, and forecast drift—delivered as an executive report with a live walkthrough.
View engagement details →
A focused diagnostic of CRM hygiene, stage definition consistency, and data gaps that distort your pipeline readings—completed in ten business days with a remediation checklist.
View engagement details →
A half-day working session where your commercial team recalibrates commit criteria, inspects forecast drift patterns, and agrees on stage exit definitions—with printed reference cards for each rep tier.
View engagement details →What We Measure
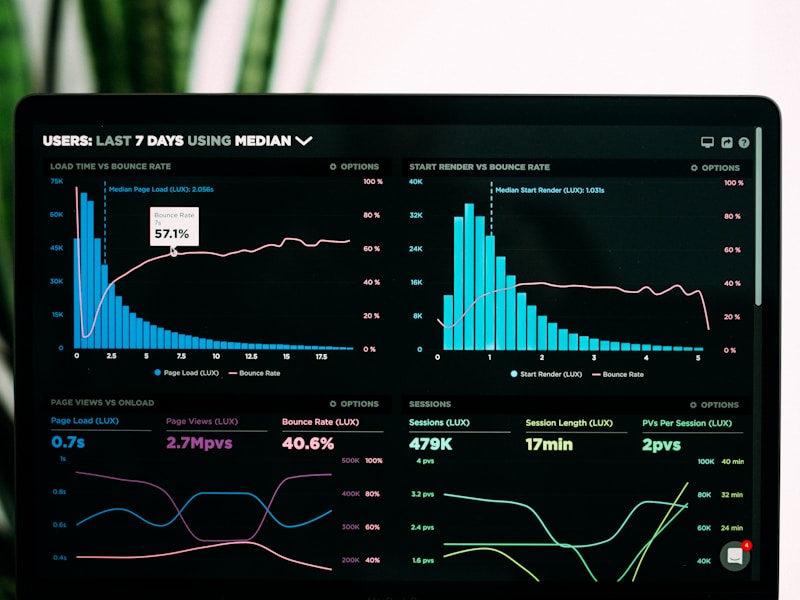
We pull these readings from your Salesforce, HubSpot, or Pipedrive export—whichever system your reps already use. No migration, no new login. You receive a bound PDF report and a 90-minute walkthrough with your commercial team in Busan or via video.
Client Evidence
Before Hazel Hub, our forecast calls ran two hours because nobody agreed on which deals were real. After the Q2 review, we cut that to forty minutes. The stage-velocity chart alone showed us where enterprise deals were stalling—something our CRM dashboard never surfaced clearly.— Min-jae K., Commercial Director, Industrial Components (Seoul)
The report was thorough, though I wished the win-loss section had included more competitor names from our field notes. Still, the forecast drift analysis changed how we set commit numbers for the board.— Sarah L., VP Sales, Logistics Software (Singapore)